Correlated uncovers surprising connections between seemingly unrelated things, and you can help by answering the weekly poll. At the end of the week, we'll tally up all the poll responses and compare the results to all of the previous polls. Check back to see which answers have the strongest correlation.

About the book!

February 7's correlation

In general, 17 percent of people say they would be uncomfortable sharing a water bottle with a close friend. But among those who are badly in debt, 38 percent would be uncomfortable sharing a water bottle with a close friend.

Based on a survey of 80 people who say that they are badly in debt and 338 people total.
February 6's correlation

In general, 48 percent of people say they tend to stick to their decisions. But among those who say their favorite kind of doughnut doesn't have a hole in it, 65 percent tend to stick to their decisions.

Based on a survey of 148 people who say their favorite kind of doughnut doesn't have a hole in it and 374 people total.

February 5's correlation

In general, 63 percent of people prefer soft-shell tacos, rather than hard-shell tacos. But among those who dislike kettle chips, 85 percent prefer soft-shell tacos.

Based on a survey of 76 people who don't like kettle chips and 388 people total.

February 4's correlation

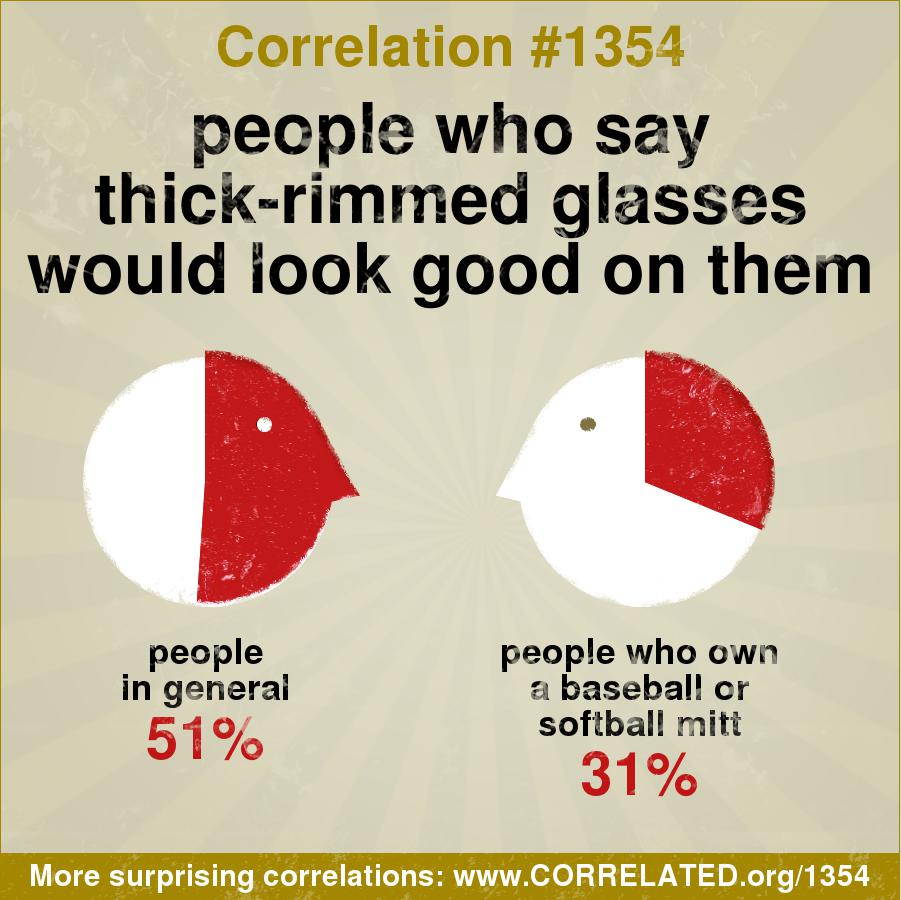
In general, 51 percent of people say thick-rimmed glasses would look good on them. But among those who own a baseball or softball mitt, only 31 percent say thick-rimmed glasses would look good on them.

Based on a survey of 100 people who own a baseball or softball mitt and 408 people total.

February 3's correlation

In general, 61 percent of people are more likely to wear a rounded-neck than a V-neck sweater. But among those who aren't interested in swing dancing, 79 percent are more likely to wear a rounded-neck sweater.

Based on a survey of 122 people who aren't interested in swing dancing and 370 people total.

February 2's correlation

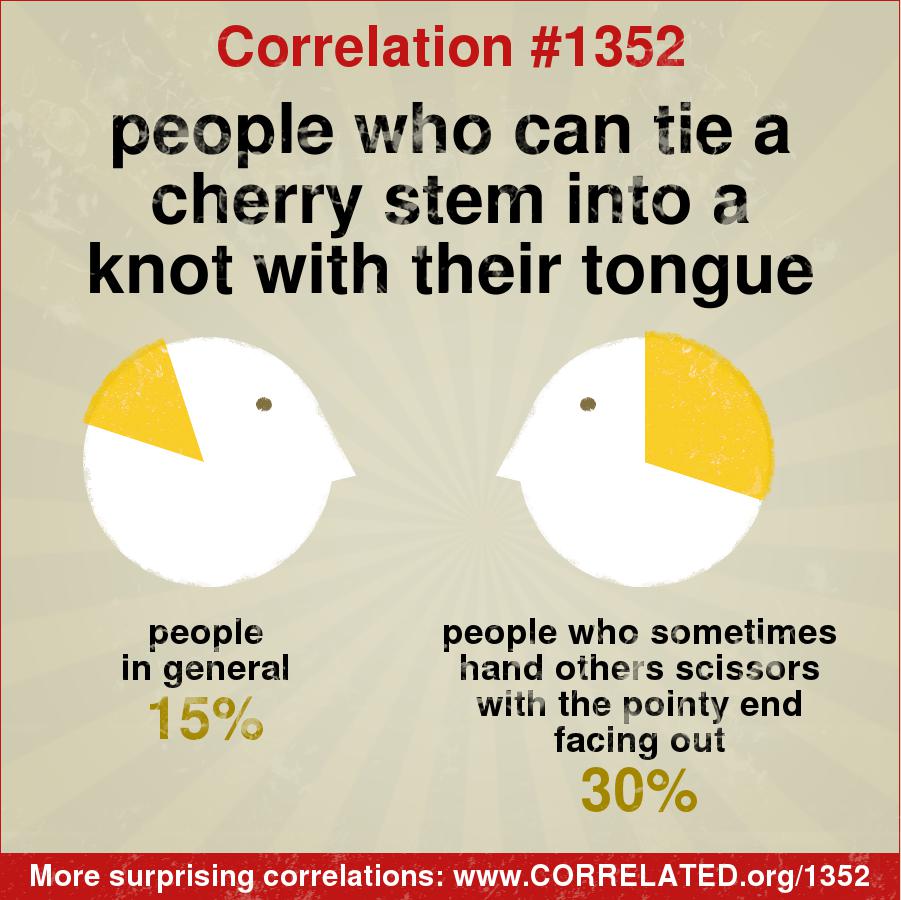
In general, 15 percent of people can tie a cherry stem into a knot with their tongue. But among those who sometimes hand people scissors with the pointy end facing out, 30 percent can tie a cherry stem into a knot with their tongue.

Based on a survey of 137 people who sometimes hand people scissors with the pointy end facing out and 388 people total.

February 1's correlation

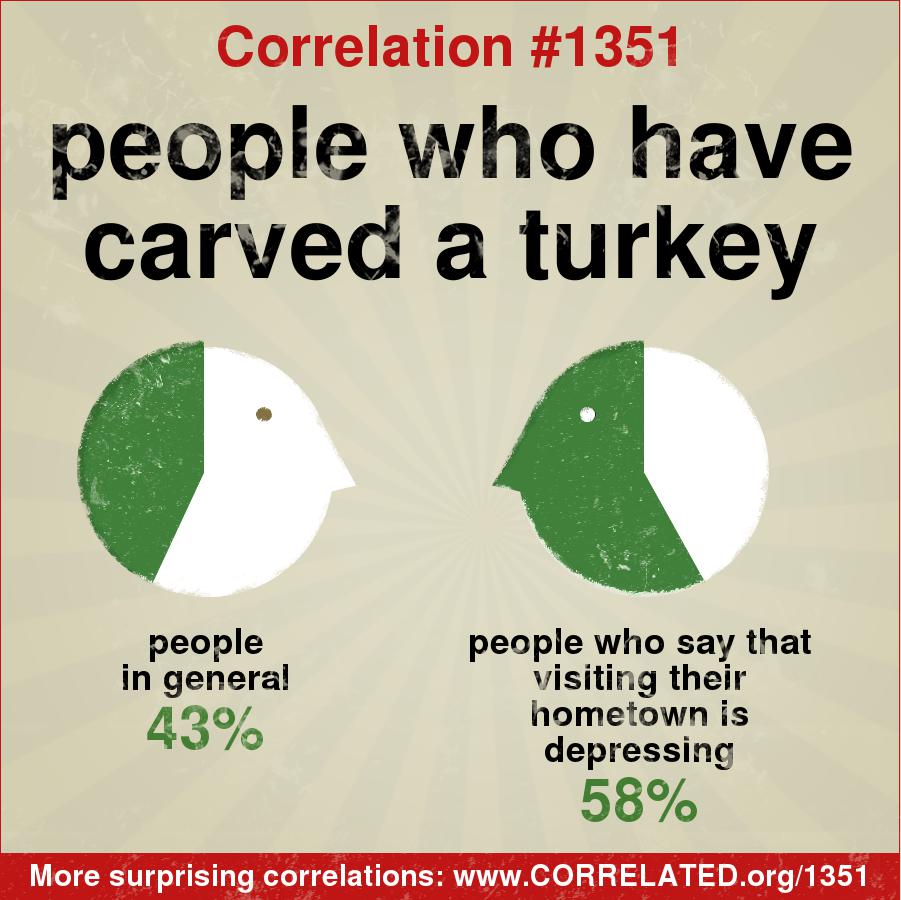
In general, 43 percent of people have carved a turkey. But among those who say that visiting their hometown is depressing, 58 percent have carved a turkey.

Based on a survey of 132 people who say that visiting their hometown is depressing and 343 people total.

January 31's correlation

In general, 57 percent of people prefer Hillary Clinton over Bill Clinton. But among those who say that their photo on their government-issued ID is extremely unflattering, 74 percent prefer Hillary Clinton over Bill Clinton.

Based on a survey of 122 people who say that their photo on their government-issued ID is extremely unflattering and 406 people total.

January 28's correlation

In general, 29 percent of people own tie-dye clothing. But among those who eat yogurt or pudding with the spoon upside down, 50 percent own tie-dye clothing.

Based on a survey of 60 people who eat yogurt or pudding with the spoon upside down and 377 people total.

January 27's correlation

In general, 37 percent of people claim to be good Frisbee throwers. But among those who say that if they were part of a songwriting duo, they'd be better at writing the music than writing the lyrics, 55 percent claim to be good Frisbee throwers.

Based on a survey of 102 people who say that if they were part of a songwriting duo, they'd be better at writing the music than writing the lyrics and 375 people total.

January 26's correlation

In general, 54 percent of people consider themselves late bloomers. But among those who fold their pizza slices, 78 percent consider themselves late bloomers.

Based on a survey of 91 people who fold their pizza slices and 397 people total.

January 25's correlation

In general, 36 percent of people prefer "okay" over "OK." But among those who play with their hair a lot, 55 percent prefer "okay" over "OK."

Based on a survey of 118 people who play with their hair a lot and 370 people total.

January 24's correlation

In general, 44 percent of people say they are more likely to wear a school backpack on one shoulder than on two. But among those whose favorite thing to put on fries is not ketchup, 61 percent are more likely to wear a school backpack on one shoulder.

Based on a survey of 152 people who say their favorite thing to put on fries is not ketchup and 370 people total.

January 23's correlation

In general, 49 percent of people are good at wrapping presents. But among those who don't mind admitting that they cry over beautiful sunsets, 67 percent are good at wrapping presents.

Based on a survey of 133 people who don't mind admitting that they cry over beautiful sunsets and 374 people total.

January 22's correlation

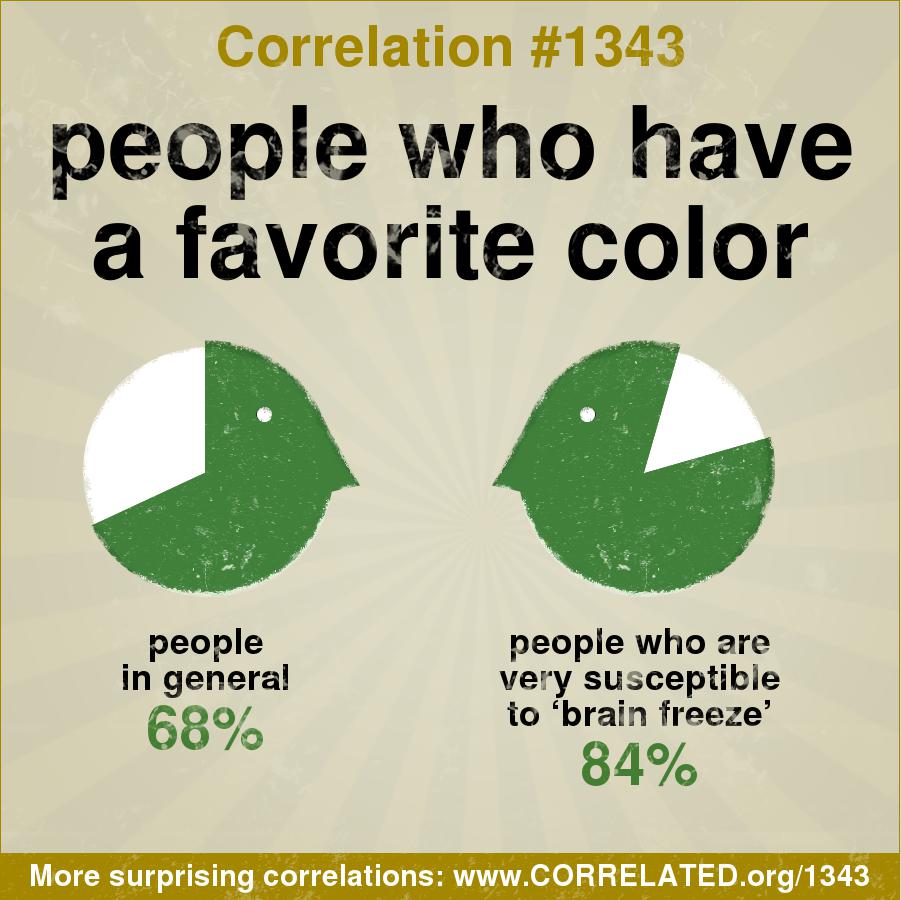
In general, 68 percent of people have a favorite color. But among those who say they are very susceptible to "brain freeze," 84 percent have a favorite color.

Based on a survey of 119 people who are very susceptible to "brain freeze" and 374 people total.

January 21's correlation

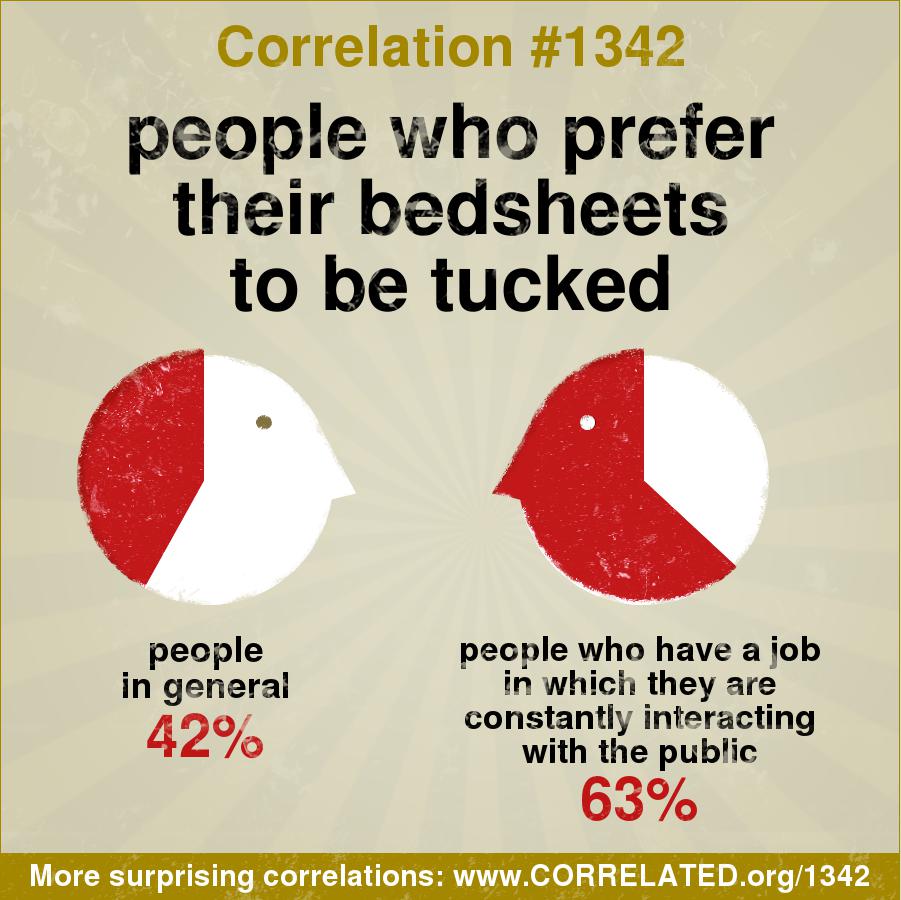
In general, 42 percent of people prefer their bedsheets to be tucked. But among those who have a job in which they are constantly interacting with the public, 63 percent prefer their bedsheets to be tucked.

Based on a survey of 98 people who have a job in which they are constantly interacting with the public and 376 people total.

January 20's correlation

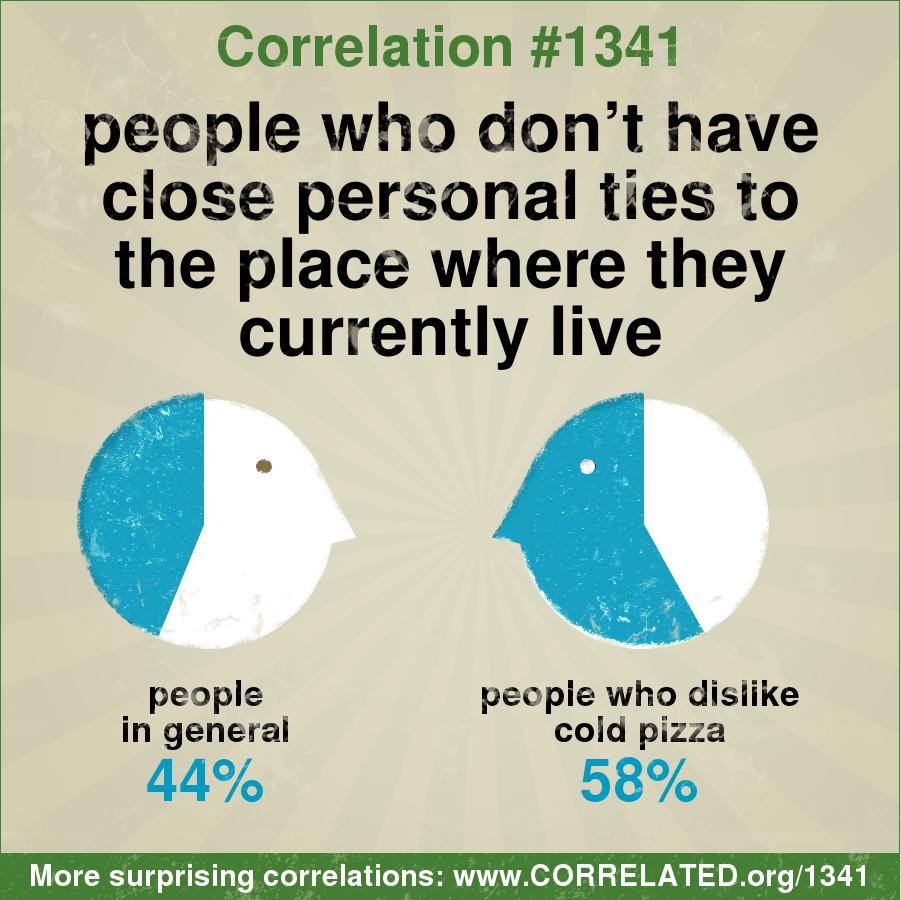
In general, 44 percent of people don't have close personal ties to the place where they currently live. But among those who dislike cold pizza, 58 percent don't have close personal ties to the place where they currently live.

Based on a survey of 136 people who don't like cold pizza and 417 people total.

January 18's correlation

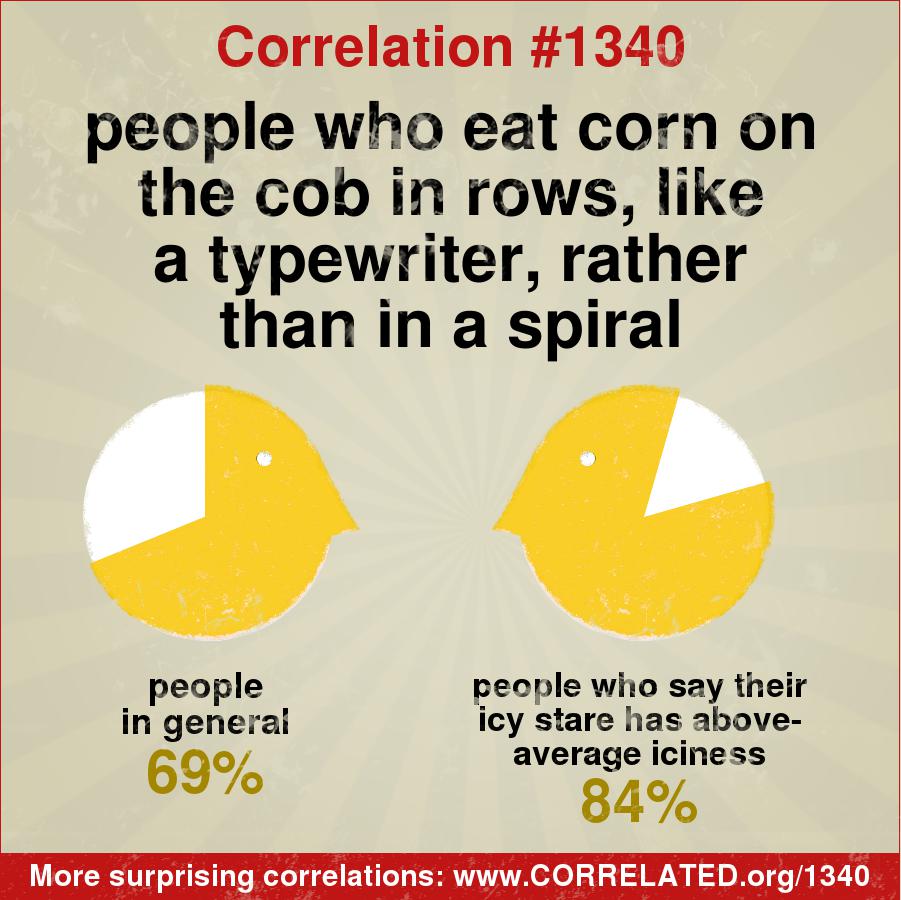
In general, 69 percent of people eat corn on the cob in rows, like a typewriter, rather than in a spiral. But among those who say their icy stare has above-average iciness, 84 percent eat corn on the cob in rows, like a typewriter.

Based on a survey of 123 people whose icy stare has above-average iciness and 341 people total.

January 17's correlation

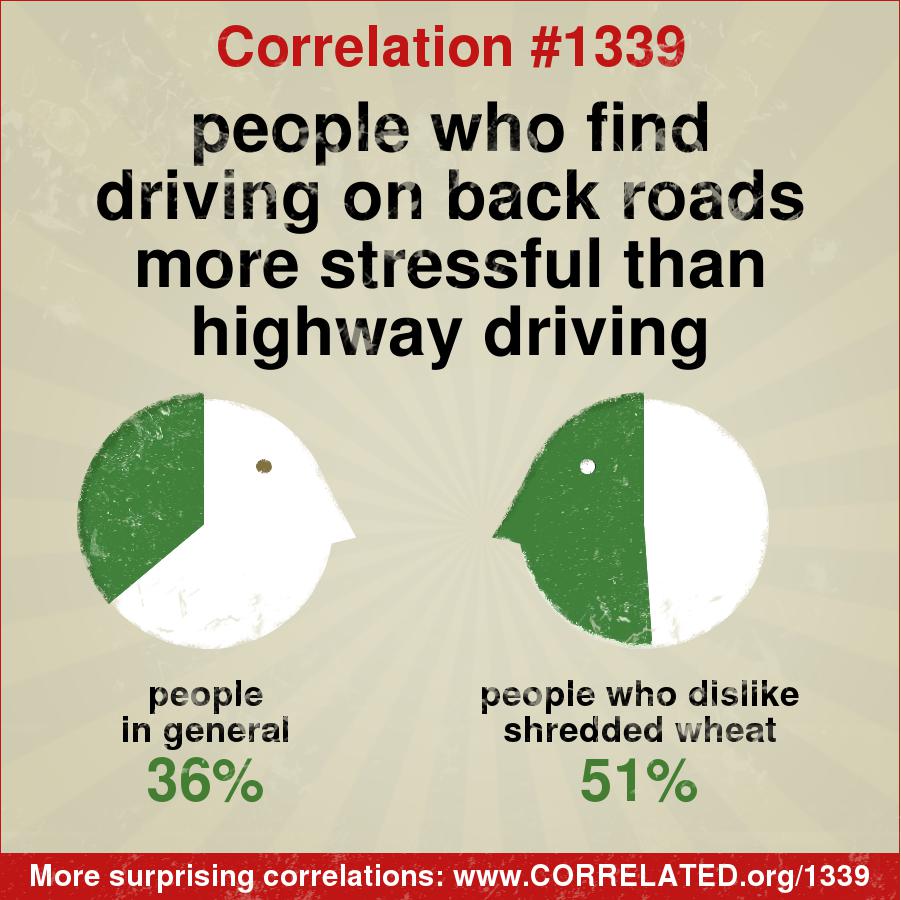
In general, 36 percent of people find driving on back roads more stressful highway driving. But among those who dislike shredded wheat, 51 percent find driving on back roads more stressful highway driving.

Based on a survey of 115 people who don't like shredded wheat and 342 people total.

January 16's correlation

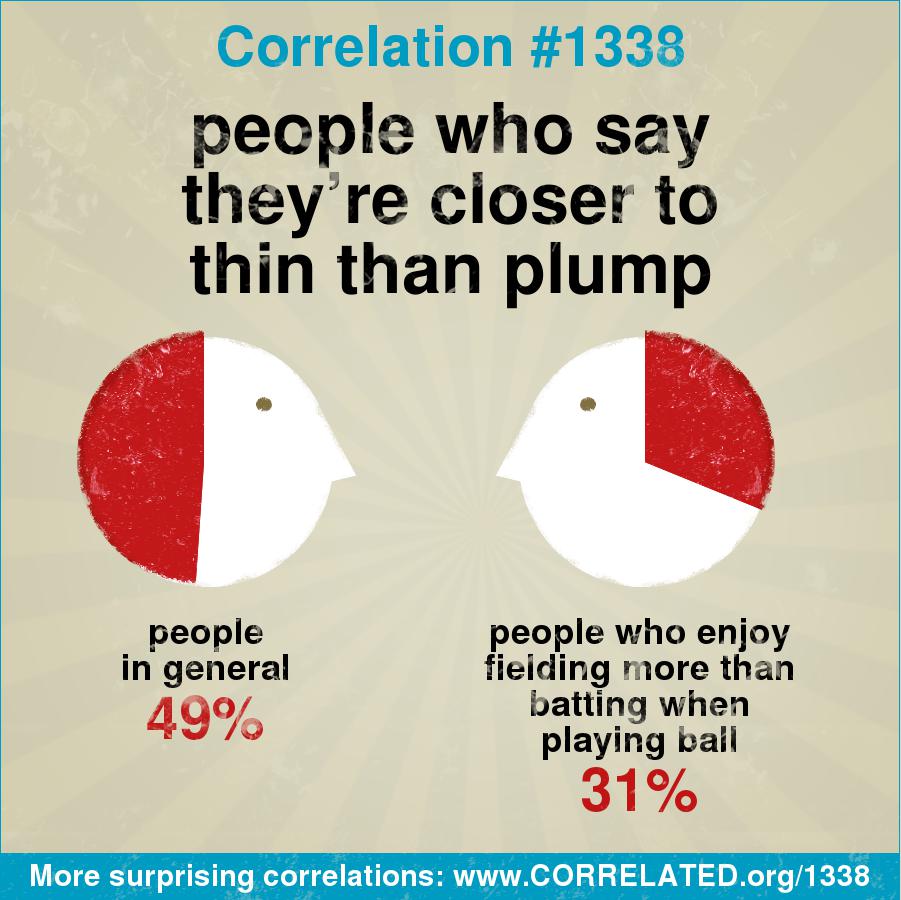
In general, 49 percent of people describe themselves as closer to thin than plump. But among those who enjoy fielding more than batting when playing ball, only 31 percent say they're closer to thin than plump.

Based on a survey of 113 people who enjoy fielding more than batting and 366 people total.

Thanks! We've recorded your response!

To make correlations, we need to track your survey responses over time.

Please log in, or create a free account below.

E-mail:
Pick a password:  
 
First name:

Send me the daily results e-mail

I'm cool with the Privacy Policy


  Close this window

To make correlations, we need to track your survey responses over time.

Please log in, or create a free account below.

E-mail:
Pick a password:  
 
First name:

Send me the daily results e-mail

I'm cool with the Privacy Policy


  Close this window

Log in below. If you've forgotten your password, enter your email address but leave the password field blank. A new password will be emailed to you.

E-mail:
Pwd:

  Close this window

Edit your account settings:

E-mail:
First name:
New password?

Send me the daily results e-mail


  Close this window

About Correlated

Are apartment dwellers more likely to read comic books? Do people who square dance have higher-than-average auto accident rates? Are people who drive domestic cars more likely to prefer Coke over Pepsi?

Correlated helps discover surprising correlations between seemingly unrelated things.

By answering each day's survey question, you'll help us make new correlations.

At the end of the day, the results of the survey are compared with the results of all previous surveys, and the two outcomes with the strongest link are highlighted. (Learn more about how this is calculated)

It's fun. It's painless. It's free. Enjoy.

Shaun Gallagher, Correlated founder


Close this window